January 2026 marks a pivotal planning period for manufacturers. The post-festive season provides data. Quarter four targets need setting. Growth strategies require validation. Yet many organizations are making these critical decisions based on incomplete information—seeing what shipped to distributors but not what actually moved at retail level. In a market where 80% of FMCG volume still flows through general trade channels, this visibility gap represents a significant strategic blind spot.
The General Trade Visibility Challenge
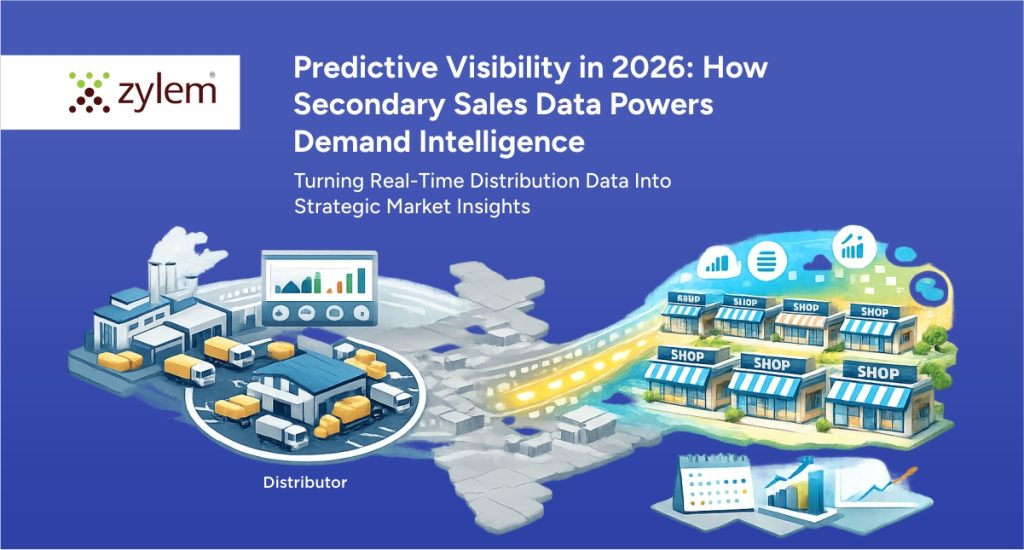
The Indian distribution landscape presents a unique complexity. Approximately 80% of FMCG volume continues flowing through general trade channels—traditional kirana stores, local distributors, and independent retailers. These channels lack the digital tracking infrastructure common in modern retail chains.
For manufacturers, this creates a fundamental information problem. Primary sales data shows what shipped from factories to distributors. Invoices are generated. Revenue is recorded. Territory-wise dispatch numbers appear in reports. This data is accurate for what it measures, but it measures only half the story.
Secondary sales data reveals what distributors actually sold to retailers. This is where real consumer demand becomes visible. A product sitting in a distributor warehouse for three months tells a very different story than one flying off retail shelves weekly. Yet without systematic secondary sales tracking, manufacturers see only the initial shipment, not the subsequent retail movement.
The gap between these metrics matters significantly for planning. January 2026 represents a critical juncture. Post-festive season data from October through December provides insights into actual consumer behavior. Quarter four fiscal targets need finalization. Growth strategies for the remainder of the year require validation. Making these decisions based solely on primary sales data means planning with incomplete market intelligence.
Tier II and III cities compound this challenge. These markets are driving significant growth in 2026, yet they’re precisely where traditional tracking is weakest. Distributors in these regions often operate with basic billing systems. Retailers are increasingly digital-savvy consumers themselves, but the distribution serving them remains largely analog. The visibility gap is widest where growth opportunity is strongest.
Manual data collection approaches cannot bridge this gap effectively. Requesting distributors to compile and submit secondary sales reports creates lag time. Data arrives weeks after transactions occurred. Compilation errors are common. Format inconsistencies make aggregation difficult. By the time information reaches planning teams, it describes historical conditions rather than current market dynamics.
From Reactive Reporting to Predictive Intelligence
Traditional distribution management operated on reactive principles. Month-end reports got compiled. Performance against targets was reviewed. Problems that emerged were addressed retroactively. This approach assumed relatively stable market conditions where monthly cycles provided sufficient responsiveness.
The market in 2026 no longer affords that luxury. Consumer preferences shift faster. Competitive moves require quicker response. Regional variations demand more granular attention. The reactive model gives way to predictive intelligence—using current data to anticipate future patterns rather than merely recording past results.
Predictive visibility means transforming secondary sales data from historical record into forward-looking intelligence. When manufacturers can see what’s actually selling at retail level in real-time, patterns emerge that enable anticipation rather than just reaction.
Regional demand patterns become identifiable. Certain products show strong velocity in specific territories while moving slowly in others. This granularity enables resource allocation based on actual consumption rather than aggregate national averages. Marketing investments flow to regions demonstrating genuine traction. Sales support focuses where products are gaining momentum.
Product velocity trends at retail level reveal which items are genuinely resonating with consumers versus which distributors stock out of relationship obligation. Production planning aligns with actual consumption patterns rather than distributor ordering behavior. Inventory strategies account for real movement rates, reducing both stockout and overstock risks.
Seasonal consumption forecasting improves with historical secondary sales data. Holiday periods, harvest seasons, regional festivals—these create predictable demand patterns, but only if retail-level consumption is tracked systematically. Primary sales data shows when distributors prepared for seasons by stocking up. Secondary sales data shows whether consumers actually bought what was anticipated.
Stock aging visibility across the distribution network flags problems early. Products sitting in distributor warehouses represent capital tied up and potential obsolescence. Without secondary sales tracking, this inventory remains invisible until distributors stop ordering because they’re already overstocked. Real-time visibility enables proactive intervention—adjusting production, offering support to move aging inventory, or recognizing that certain products aren’t performing as hoped.
Early warning signals for market shifts emerge from secondary sales patterns. When retail movement in a region declines despite distributors maintaining their purchase levels, competitive pressure is often the cause. New entrants, aggressive pricing by rivals, or shifting consumer preferences show up first in retail data, not in manufacturer-to-distributor transactions. This advance visibility enables faster strategic response.
The shift happening in 2026 moves from historical analysis to forward-looking intelligence. From aggregate national data to granular regional insights. From monthly batch reports to continuous monitoring. From reactive problem-solving to proactive opportunity capture. Secondary sales visibility makes this transition possible.
Automated Data Extraction as Foundation
The challenge of secondary sales tracking has always been operational. Manufacturers want the data. Distributors have the data. But extracting it systematically has proven difficult.
Distributors use varied billing systems. Large distributors might have sophisticated ERP platforms. Mid-sized ones often use commercial accounting software. Smaller distributors sometimes still work with Excel-based systems. Asking all of them to adopt a manufacturer’s preferred tracking system creates friction and cost that distributors reasonably resist.
Manual data requests place burden on distributor staff. Compiling sales reports, formatting them correctly, submitting them on schedule—these tasks compete with serving customers and managing their own operations. When dozens of manufacturers make similar requests, the administrative load becomes significant. Compliance is inconsistent. Data quality suffers. Timeliness deteriorates.
Automated extraction technology addresses this fundamental challenge. Advanced systems can capture data from diverse billing platforms without requiring changes to distributor operations. Whether the distributor uses ERP software, accounting packages, or spreadsheet-based systems, extraction happens systematically.
The technology works at invoice level. Individual transaction details—products sold, quantities, prices, customer information, dates—get captured directly from source systems. This granularity enables sophisticated analysis impossible with summary-level reporting. Pattern recognition, anomaly detection, and predictive modeling all depend on detailed transactional data.
Time lag from transaction to visibility disappears. Traditional manual reporting creates weeks of delay between sale and manufacturer awareness. Automated extraction enables near real-time synchronization. Sales that occur today become visible tomorrow, not next month. This responsiveness transforms data from historical record to operational intelligence.
Accuracy improves dramatically. Manual transcription introduces errors. Automated capture eliminates this source of mistakes. What the distributor system recorded is what the manufacturer receives. Reconciliation becomes straightforward. Disputes over data accuracy largely disappear.
Scalability becomes feasible. Manual processes that work adequately with ten distributors become unmanageable with hundreds. Automated systems scale across thousands of distributor points without proportional increase in administrative burden. Large distribution networks receive the same systematic treatment as small ones.
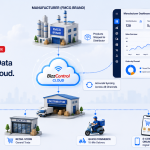
Real-time synchronization to centralized monitoring creates unified visibility. Primary sales from the manufacturer. Secondary sales from distributors to retailers. Current stock levels across the distribution network. All of this flows into a single interface where relationships and patterns become apparent.
Integration with analytics platforms enables sophisticated use of this data. Visual dashboards show trends across regions, products, and time periods. Comparative performance analysis reveals which territories, distributors, or products outperform expectations. Automated alerts flag anomalies requiring attention. Customized reports serve different stakeholder needs—sales leadership sees market trends, operations tracks inventory, finance monitors working capital efficiency.
The foundation for predictive capability is data quality and timeliness. Automated extraction delivers both. Predictions built on current, accurate, granular data are fundamentally more reliable than those based on delayed, aggregated, manually compiled information.
Zylem’s Approach to Secondary Sales Intelligence
Zylem addresses the secondary sales visibility challenge through patented data extraction technology designed specifically for India’s diverse distribution landscape. The system captures invoice-level sales and stock data directly from disparate distributor billing systems without requiring manual intervention or changes to distributor operations.
The Continuous Monitoring Hub provides centralized visibility into primary sales, secondary sales, and inventory levels across the distribution network. This unified view eliminates the fragmentation that typically characterizes distribution data. Decision-makers access current information rather than waiting for periodic reports.
Real-time synchronization means sales that occur today become visible tomorrow. This responsiveness enables proactive management rather than reactive correction. Problems get identified while they’re still manageable. Opportunities get captured while they’re still available.
The platform’s scalability supports distribution networks of any size. Configuration for over 40,000 distributors nationwide demonstrates capability to serve large-scale operations in pharmaceutical, FMCG, and agriculture sectors where complex distribution is standard.
Integration with business intelligence platforms extends analytical capability. Power BI connectivity enables visual representation of trends and patterns. Custom reporting serves diverse stakeholder needs across the organization. The data becomes accessible and actionable, not just collected and stored.
The system specifically addresses the general trade visibility gap that characterizes Indian markets. Where 80% of FMCG volume flows through channels lacking inherent digital tracking, systematic extraction and consolidation of secondary sales data transforms operational capability. Manufacturers gain the market intelligence necessary for strategic planning in growth markets.
Strategic Intelligence for Growth Markets
The distribution landscape in 2026 rewards organizations that can see clearly and move quickly. As growth increasingly comes from Tier II and III markets where traditional tracking is weakest, secondary sales visibility transforms from optional enhancement to competitive necessity.
Predictive capability—understanding not just what happened but what’s likely to happen—requires foundation of real-time, accurate data from actual retail movement. Manufacturers who build this visibility are equipped for proactive decision-making. Resource allocation becomes strategic. Production planning aligns with consumption. Marketing investments flow to genuine opportunities.
Organizations continuing to rely on primary sales data alone are navigating growth markets with incomplete information. They see distributor behavior but not market reality. They make decisions based on shipments rather than consumption. The planning advantage goes to those with complete visibility.
January 2026 planning cycles will reveal which organizations have this visibility and which are still working with partial information. The decisions made now—production commitments, inventory strategies, marketing allocations, target setting—will shape results throughout the year. Those decisions are only as good as the data informing them.
The question manufacturers face is straightforward: Will 2026 planning be based on complete market intelligence including retail-level consumption, or will it rely solely on what shipped to distributors? The difference becomes clear in quarterly results.
Learn how Zylem provides secondary sales intelligence for strategic planning at zylem.co.in
FAQs
Secondary sales data tracks what distributors sell to retailers, as opposed to primary sales which tracks what manufacturers sell to distributors. This matters because primary sales only show inventory movement to the distribution channel, not actual consumer demand. Secondary sales reveal what's genuinely selling at retail level, providing accurate demand signals for production planning, inventory management, and strategic decision-making. In Indian markets where 80% of FMCG volume flows through general trade, secondary sales visibility is essential for understanding real market performance.