You Spent $1 Million on Trade Schemes Last Year. Do You Know Which Ones Actually Worked?
Why Scheme ROI Analytics Is the Missing Layer in FMCG Trade Promotion Management
Every FMCG brand in India runs trade schemes. Volume-based incentives. Slab discounts. Retailer loyalty programs. Seasonal push schemes. Display allowances. The average mid-size FMCG company spends 10 to 20 percent of revenue on trade promotions. For a company doing $10 million in annual revenue, that is $1 million to $2 million flowing out as trade spend every year.
Most brands can tell you how much they spent on schemes last quarter. Very few can tell you which schemes actually drove incremental revenue and which ones simply subsidized sales that would have happened anyway. The spend is tracked. The return is not.
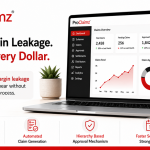
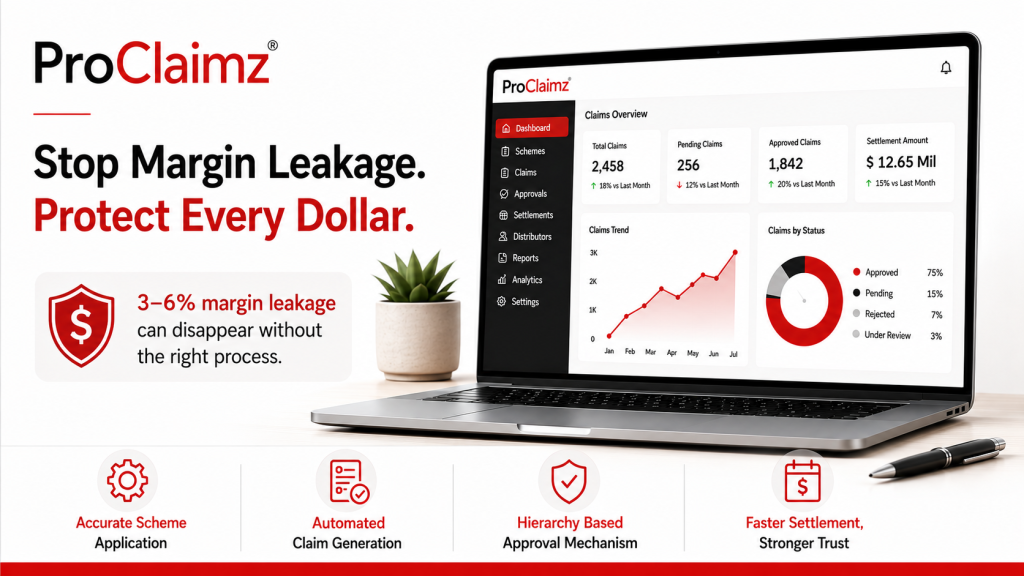
we built ProClaimz as a scheme management software that goes beyond claim processing. It captures the data needed to measure scheme effectiveness at the individual scheme creation level. Here is why that matters and what it looks like when you actually have the numbers.
The Trade Spend Visibility Gap
Trade promotions are the single largest controllable expense in FMCG distribution after cost of goods sold. Yet they are managed with less rigor than most line items half their size. A brand would never spend $60,000 on advertising without measuring the response rate. But it routinely spends $60,000 on a quarterly retailer incentive scheme with no mechanism to measure whether it generated incremental sales or simply rewarded buying that was already happening.
The reason is data. Measuring scheme ROI requires two things. First, you need accurate data on which transactions qualified for which scheme. Second, you need a baseline to compare against. What would the sales have been without the scheme? The first requires a digital claims system. The second requires historical secondary sales data. Most brands have neither.
Without this data, trade promotion planning becomes a ritual. Last year’s schemes get repeated with minor modifications. Budgets get allocated based on territory size rather than territory potential. Under-performing schemes continue because nobody has evidence to discontinue them. Over-performing schemes get under-funded because nobody can prove they deserve more budget.
What Scheme ROI Actually Looks Like
When you can measure trade promotion effectiveness at the individual scheme level, the picture that emerges is usually surprising. Most brands discover that a small number of schemes drive disproportionate results.
In a typical portfolio of 15 to 20 active trade schemes, 3 to 5 schemes will show clear incremental volume lift. These are schemes where the incentive structure aligns with actual retailer behavior and drives purchases that would not have happened otherwise. Another 5 to 7 schemes will show neutral results. The sales during the scheme period match the historical baseline. The scheme did not drive incremental behavior. It just subsidized existing demand. The remaining schemes may actually show negative ROI when you account for the margin given away relative to the incremental revenue generated.
This is not a failure of scheme design. It is a failure of measurement. Without ROI data, all schemes look equally valuable. With ROI data, the portfolio can be optimized. Budget shifts from neutral and negative-ROI schemes to the ones that actually drive growth.
How ProClaimz Captures Scheme Effectiveness Data
ProClaimz captures scheme-level transaction data that enables ROI analysis. When a scheme is configured in the scheme management software, every parameter is recorded. Applicable products. Eligible distributors. Discount structure. Validity period. Territory scope. Stacking rules. Budget allocation.
As orders flow through the system during the scheme period, every qualifying transaction is tagged to the relevant scheme. The system records which distributor, which retailer outlet, which products, what quantities, and what discount was applied. This creates a complete transaction-level record of scheme utilization.
When the scheme period ends, the data is ready for analysis. Total scheme cost can be calculated from actual disbursements, not estimates. Total incremental volume can be estimated by comparing scheme-period sales against pre-scheme baseline for the same SKUs and territories. Volume lift per rupee of trade spend becomes a measurable metric instead of a guess.
The analysis can go deeper. Which territories responded strongest to the scheme? Which distributor types showed the highest participation rates? Which product SKUs drove the most incremental volume? Did the scheme cannibalize sales from non-scheme products? Each of these questions has a data-backed answer when the transaction data is captured at the right granularity.
Moving from Scheme Repetition to Scheme Optimization
Most FMCG brands plan trade promotions on an annual or semi-annual cycle. The planning process typically involves reviewing last year’s schemes, adjusting targets upward, and distributing budgets across territories based on headcount or revenue contribution.
With scheme-level ROI data, this process transforms. Instead of repeating last year’s schemes, the brand can identify which mechanics actually drove results. Volume-based slabs may work well in one territory but not another. Display allowances may drive incremental sales in modern trade but show no impact in general trade. Seasonal push schemes may perform differently depending on timing.
This data allows the brand to construct a promotion calendar where every scheme has a tested mechanic, a defined target territory, and an expected ROI based on historical performance. Under-performing mechanics get replaced. Over-performing mechanics get expanded. The total trade spend may not change, but the return on that spend improves significantly.
ProClaimz supports this optimization cycle by maintaining a scheme performance history. Every scheme run through the system contributes to a growing database of what works, where, and under what conditions. Over two or three promotion cycles, the brand accumulates enough data to make trade planning genuinely evidence-based.
Budget Allocation Based on Territory Potential
One of the most impactful applications of scheme ROI data is territory-level budget allocation. In most FMCG companies, trade spend is allocated proportionally to territory revenue. A territory doing $600,000 per year gets more scheme budget than a territory doing $240,000, regardless of responsiveness.
But scheme responsiveness varies significantly by territory. A high-revenue territory with established retail relationships may not need heavy incentivization. A mid-revenue territory with growth potential may respond strongly to well-structured schemes. Allocating based on responsiveness rather than size redirects budget from territories where it subsidizes the status quo to territories where it drives growth.
ProClaimz gives the brand the territory-level data to make this shift. When scheme performance data is available at the territory and distributor level, budget allocation conversations move from opinion-based to evidence-based.
Making Trade Spend a Growth Lever Instead of a Cost Center
Trade promotions do not have to be an unavoidable cost of doing business. When managed through a scheme management software that captures transaction-level data, they become a measurable growth lever. The brand controls which schemes run, where they run, and what return they deliver.
If your company spent $1 million on trade schemes last year and cannot identify which ones drove incremental growth, ProClaimz gives you the infrastructure to answer that question. Talk to our team at Zylem to see how scheme-level ROI analytics can transform your trade promotion planning from ritual to strategy.
Frequently Asked Questions
Mid-size FMCG companies typically spend 10 to 20 percent of revenue on trade promotions. This includes retailer incentives, volume discounts, display allowances, seasonal push schemes, and distributor loyalty programs.
Trade promotion ROI measures the incremental revenue or profit generated by a specific trade scheme relative to its cost. A scheme that costs $12,000 and generates $30,000 in incremental revenue has a positive ROI. A scheme that costs $12,000 but only subsidizes existing sales without generating incremental volume has zero or negative ROI.
Measuring scheme ROI requires transaction-level data linking each sale to the applicable scheme, plus historical baseline data for comparison. Most brands running manual or spreadsheet-based trade promotion management lack both. Without a digital scheme management system, the data simply does not exist.
ProClaimz captures every scheme parameter at configuration. After the scheme ends, actual disbursement data and transaction records allow calculation of total cost, total incremental volume, and per-rupee effectiveness.
In a typical portfolio of 15 to 20 active schemes, only 3 to 5 usually show clear incremental volume lift. Another 5 to 7 show neutral results. The remainder may show negative ROI when margin cost is factored against incremental revenue.
ROI data reveals which territories respond most strongly to trade promotions. Brands can redirect budget from low-response territories to high-response ones, improving the overall return on the same total spend.
Yes. ProClaimz maintains a scheme performance history. Every scheme contributes to a growing database that enables evidence-based planning over time. After two to three cycles, patterns in mechanic effectiveness, territory response, and seasonal timing become clear.
Utilization measures how many distributors or retailers participated in a scheme. Effectiveness measures whether that participation drove incremental sales versus subsidizing existing demand. High utilization with no volume lift indicates a scheme that rewards existing behavior without changing it.
ProClaimz configures schemes at the territory level. Scheme rules, budgets, and eligibility criteria can vary by territory. Performance tracking is also territory-specific, enabling granular ROI comparison.
When transaction data is tagged to individual schemes, the system can identify whether a scheme drove incremental total volume or simply shifted sales from non-scheme products to scheme products. This cannibalization analysis is critical for portfolio optimization.
Launch schemes typically have higher spend and lower baseline data. ProClaimz tracks launch scheme performance separately and compares against defined targets rather than historical baselines. This gives the brand early visibility into whether the launch investment is generating the expected market traction.
Yes. ProClaimz provides scheme-level cost data that feeds into financial reporting. Trade spend can be broken down by scheme, territory, product, and time period for accurate P&L attribution.
A scheme performance history is the accumulated record of how each scheme mechanic performed across territories and time periods. This historical data enables the brand to predict scheme outcomes with increasing accuracy as the database grows.
ProClaimz generates scheme performance reports that provide data-backed inputs for planning discussions. Instead of debating opinions about which schemes worked, the team reviews actual ROI numbers and plans accordingly.
Visit zylem.co.in or contact the Zylem team to schedule a demo. The team will show you how scheme-level ROI tracking works and what insights it generates for your trade promotion portfolio.